Credit: Wikipedia. https://en.wikipedia.org/wiki/Periodic_table#/media/File:Colour_18-col_PT_with_labels.png
CONCEPTS & TERMS
mass
Mass is the quantity in a body regardless of its volume or any forces acting on it.
atomic number
The total number of protons present in the nucleus of an atom is called its atomic number.
mass number
The total number of protons and neutrons present in the nucleaus of an atom is called its mass number.
isotopes
Atoms that have the same number of protons but different numbers of neutrons are known as isotopes. Isotopes have different atomic masses. The relative abundance of an isotope is the percentage of atoms with a specific atomic mass found in a naturally occuring sample of an element. The average atomic mass of an element is a weighted average calculated by multiplying the relative abundances of the element’s isotopes by their atomic masses and the summing the products. The relative abundance of each isotope can be determined using mass spectrometry. There are three main types of subatomic particles in an atom: protons, neutrons, and electrons. A proton carries a 1+ charge, an electron carries a 1- charge, and a neutron carries 0 charge. Protons and neutrons are found in the nucleus at the center of an atom, whereas electrons are found in orbitals that surround the nucleus. Since electrons are negatively charged, they are strongly attracted to the positively charged protons in the nucleus. For example, helium atom contains 2 protons, 2 neutrons and 2 electrons. The atomic number of helium is 2, so any helium atom must have 2 protons in its nucleus and 2 electrons. Atoms of the same element can contain different number of neutrons in their nuclei and still remain their identity. Such atoms are known as isotopes, and a single element can have different isotopes. Each isotope has a unique atomic mass. The mass number of an atom is equal to the number of protons plus the number of neutrons in its nucleus. The number of neutrons is equal to the mass number minus the number of protons. For example, an atom of carbon-12 has 6 neutrons in its nucleus. Calcium-40 is the most stable isotope of calcium. A single atom of calcium-40 has 20 neutrons.
isotope notation
(1). Isotopes are specified by the name or symbol of the particular element, immediately following by a hyphen and the mass number, e.g., carbon-14 or C-14.
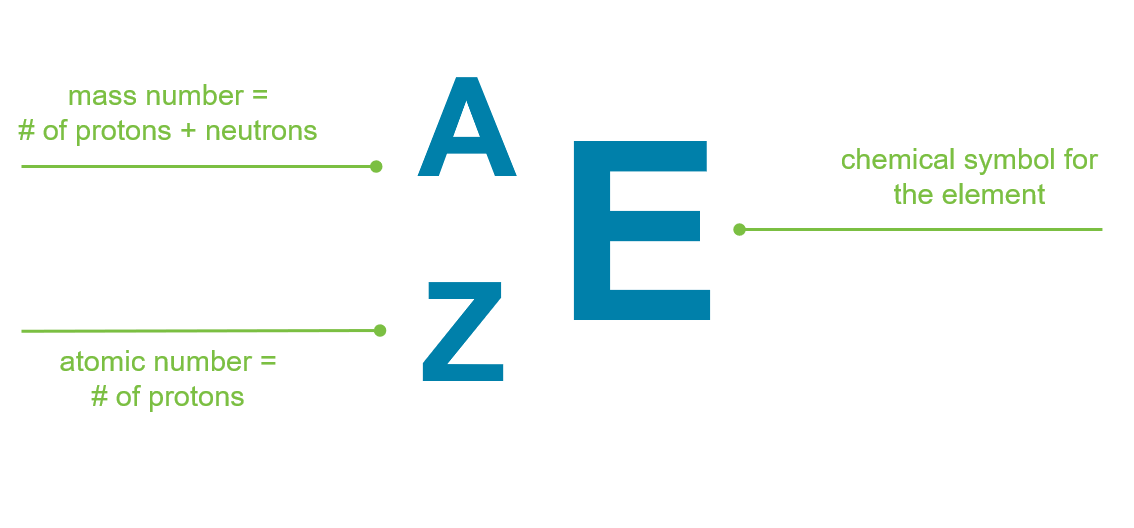
(2). Isotopes can also be defined in standard, or “AZE”, notation where A is the mass number, Z is the atomic number, and E is the element symbol. The mass number A is indicated with a superscript to the left of the chemical symbol E while the atomic number Z is indicated with a subscript.
relative isotopic mass of some elements
Hydrogen-1, H, atomic number 1, mass 1
Helium-4, He, atomic number 2, mass 4
Lithum-7, Li, atomic number 3, mass 7
Beryllium-9, Be, atomic number 4, mass 9
Sodium-23, Na, atomic number 11, mass 23
Magnesium-25, Mg, atomic number 12, mass 25
Aluminum-27, Al, atomic number 13, mass 27
Phosphorus-31, P, atomic number 15, mass 31
Argon-40, Ar, atomic number 18, mass 40
Potassium-39, K, atomic number 19, mass 39
Calcium-44, Ca, atomic number 20, mass 44
Titanium-48, Ti, atomic number 22, mass 48
Iron-56, Fe, atomic number 26, mass: 56
Iron-57, Fe, atomic number 26, mass 57
Copper-63, Cu, atomic number 29, mass 63
Strontium-88, Sr, atomic number 38, mass 88
Indium-115, In, atomic number 49, mass 115
Europium-153, Eu, atomic number 63, mass 153
concentration
Concentration is a measure of the relative amount of dissolved substances in a solution. Concentration can be expressed in many different ways.
parts per million (ppm)
The number of grams of an element dissolved in 1,000,000 g of water.
Parts per million or ppm describes the concentration of something in water. One ppm is equivalent to 1 milligram of something per liter of water (mg/l) or a milligram of something per kilogram (mg/kg).
parts per billion (ppb)
The number of grams of an element dissolved in 1,000,000,000 g of water.
trace element
Elements with concentrations measured in ppm or ppb are called trace elements. For example, if 40g of a trace elememt are found in 1,000,000 g of water, the trace element’s concentration is 40 ppm.
parts per thousand (ppt)
Concentration can be expressed in terms of the number of grams of an element dissolved in 1,000 g of water. The unit for this measure is parts per thousand, or ppt. For example, salinity is hte measure of the number of grams of salts per kilogram (kg) of water. The average salinity of seawater is about 35 g/kg of seawater, or 35 ppt.
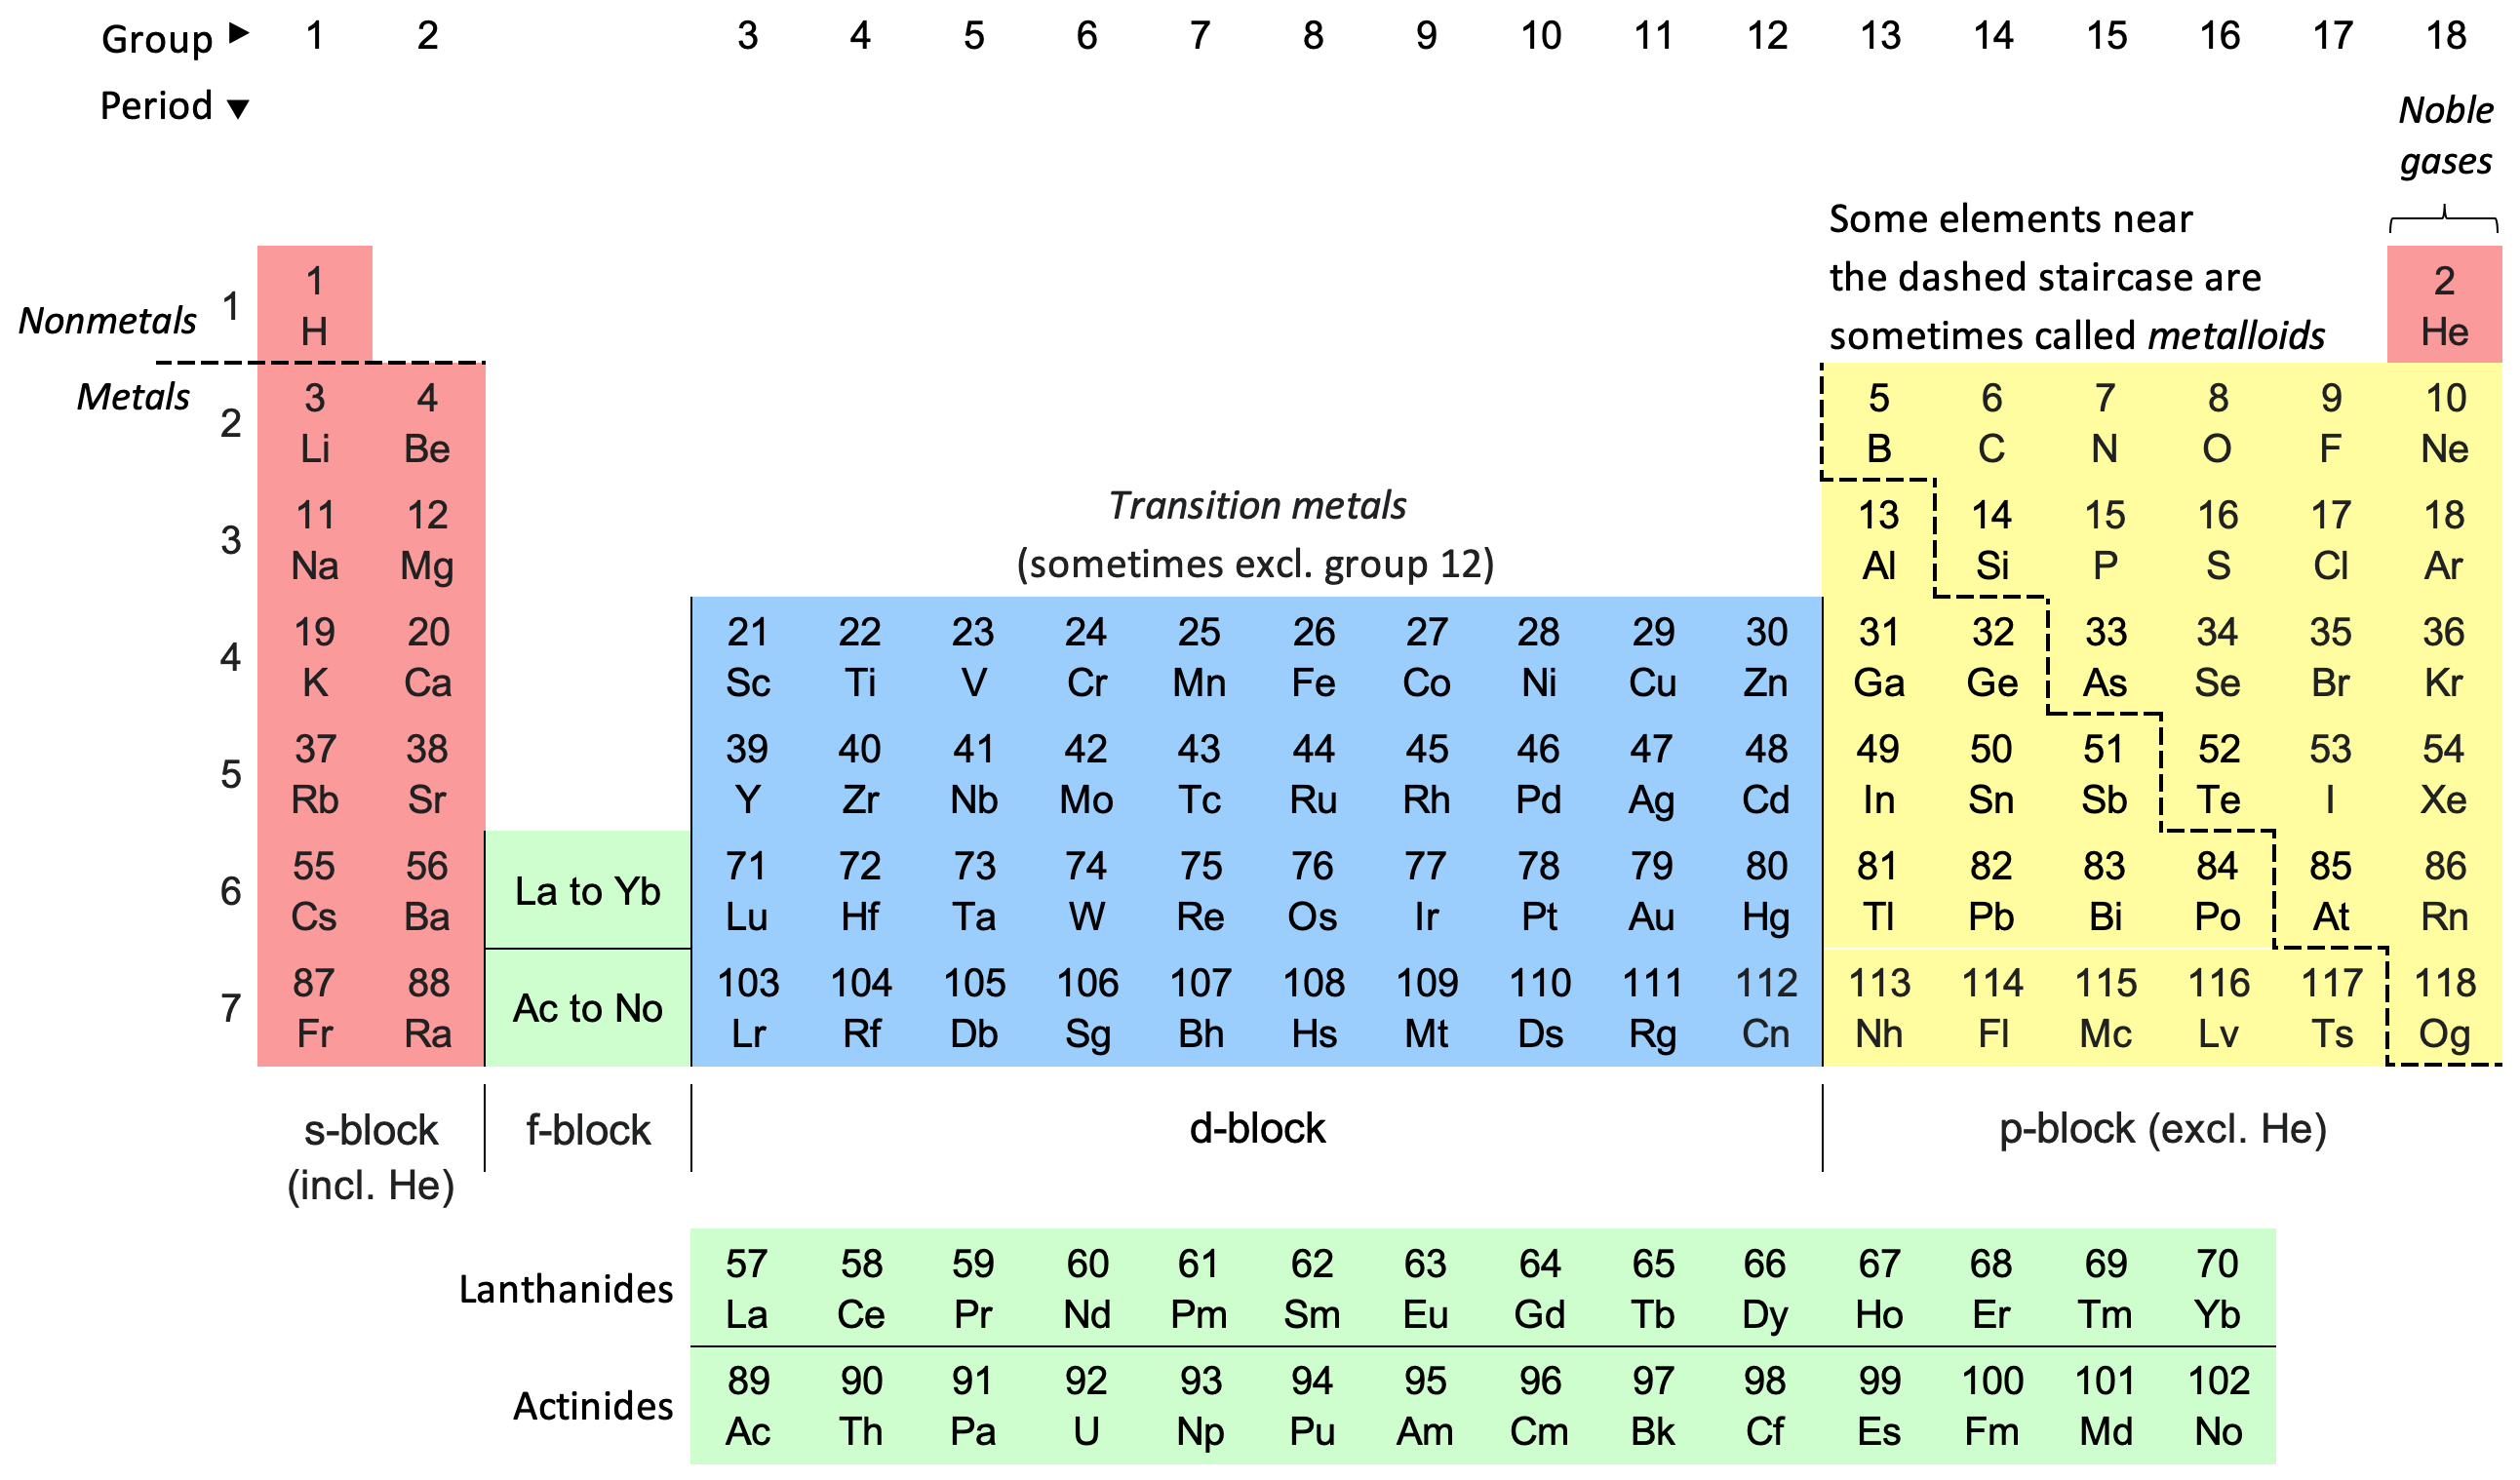
periodic table
The periodic table arranges all the known elements in an array. Elments are arranged left to right and top to bottom in order of increasing atomic number, which coincides with increasing atomic mass. The rows of elements are periods. The period number of an element signifies the highest energy level an electron in that element occupies. There are 118 known elements today. The first periodic table was published by Dmitri Mendeleev in 1869. Everything around us is made of different combinations of elements. Elemental analysis can help you identify which elements something is made of. You may want to measure elements, rather than the molecues and compounds.
plasma
Plasma is often called the fourth state of matter after solid, liquid, and gas, and refers to a gas of charged particles generated by ionization. Plasma exists in a very high-energy (high temperature) state and the temperature of the Ar Plasma ranges between 6,000 K and 10,000 K.
counts per second (cps)
Counts per second, abbreviated to cps. Sensitivity is expressed as counts per second per unit concentration (e.g. cps/ppb). Without sufficient sensitivity, small particles cannot be detected.
analyte
Analyte refers to the component of a sample that is ultimately determined directly or indirectly.
matrix
Matrix refers to the components of a sample other than the analyte of interest.
The matrix can have a considerable effect on the way the analysis is conducted and the quality of the results are obtained; Such effects are called matrix effects.
standard solution
A standard solution is a solution containing an accurately known concentration.
Standards are prepared in volumetric flasks.
The mass concentration μg ml-1 (it could also be expresses as mg l-1) is also referred to as ppm (parts per million).
commonly used prefixes (multiple-prefix-symbol)
103: kilo, K
106: mega, M
109: giga, G
1012: tera, T
1015: peta, P
10-3: milli, m
10-6: micro, μ
10-9: nano, n
10-12: pico, p
10-15: femto, f
limit of detection (LOD)
The limit of detection (LOD) of an analytical procedure is the lowest amount of analyte in an unknown sample that can be detected but not necessarily quantified, that is, recorded as an exact concentration.
accuracy
Accuracy refers to the difference beetween the mean of a set of results or an individual result and the value that is accepted as the true or correct value for the quantity being measured.
precision
Precision refers to the closeness of agreement between independent test results obtained under stipulated conditions.
bias
Bias characterizes the systematic error in each analytical procedure and is the deviation of the mean analytical result from the true value.
DATA ANALYSIS
Excel
- Hide rows or columns: right-click the selected rows or columns and then select Hide
- Unhide: Format -> Column -> Unhide
- Dollar sign: Add dollar sign for absolute reference before the row and the column, e.g., $AG142, G$48
- Freeze first two columns: Select the third column and select View -> Freeze Panes
- Freeze first two rows: Select the cell (third row and thir column) and select View -> Freeze Panes
graph
You can plot a graph with Excel, or Python, or by hand (I recommend you always try to plot a graph by hand first if you are a new learner- you need the skill to plot a graph). Graphs are used to describe a relationship between two variables, x and y. It is normal practice to identify the x-axis as the horizontal axis for the independent variable, e.g., concentration in μg ml-1. The y-axis is used to plot the dependent variable, y, e.g., signal response in mV. The mathematical relationship for straight line graphs is: y = mx + b, where y is the signal response in mV, x is the concentration in μg ml-1, m is the slope of the line of best fit of the graph, and c is the intercept on the x-axis.
linest function in Excel
The linest function in Excel is a tool to fit a line (y=mx+b) to the data in order to identify the relationship between two variables (x and y). The linest function uses the least square procedure which fits a line to a set of data points by minizing the sum of the squares of the residuals of the points from the curve.
You need two columns of data, one for variable x and one for y.
x y
1 1
9 1.35
16 1.36
24 1.24
31 1.21
38 1.16
polynomial interpolation in Excel
Polynomial interpolation is a method of finding a polynomial function that fits a set of data points. One of the most common ways to perform polynomial interpolation is by using the Lagrange polynomial.
Excel formula to calculate a polynomial trendline:
y = a1 x^3 + a2 x^2 + a3 x^ + a4
a1 = INDEX(LINEST(y,x^{1,2,3}),1,1)
a2 = INDEX(LINEST(y,x^{1,2,3}),1,2)
a3 = INDEX(LINEST(y,x^{1,2,3}),1,3)
a4 = INDEX(LINEST(y,x^{1,2,3}),1,4)
LEARNING MATERIALS